The SAT score have been increased 185 points since 2013. The SAT score has risen almost every year over the past decade, and have continued to rise especially recent years at BU. Compared to previous year, the SAT score increased by 30 points at BU. Compared to similar schools, the submitted SAT and ACT scores are extremely competitive and high at BU.
You can check and compare colleges with similar SAT scores BU by SAT score range 1370-1470, 1420-1520, and 1470-1570.
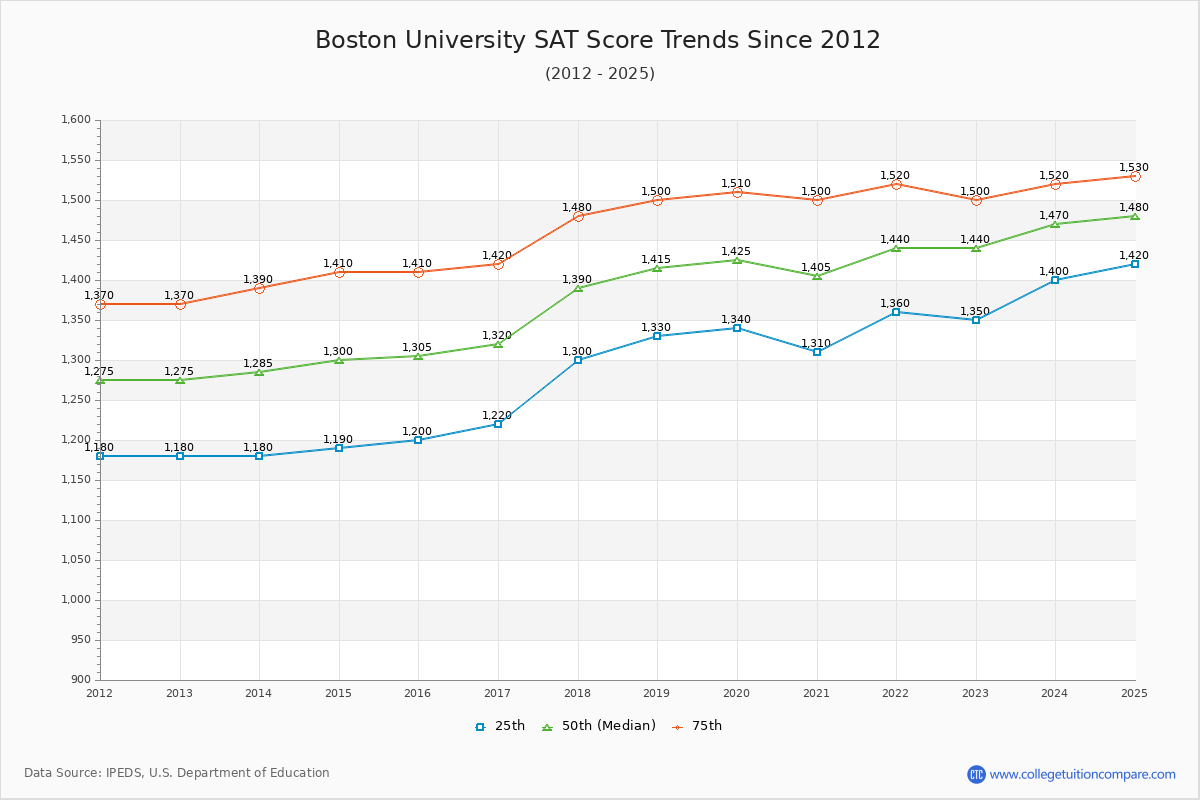
The 2024 SAT score is 1470 at BU. Over the past 12 years, the average SAT score is 1289 (25 th percentile) and 1469 (75 th percentile). Compared to similar schools, the submitted SAT scores are extremely competitive and high at BU.
The following table and chart illustrate the changes in SAT scores at Boston University since 2013.
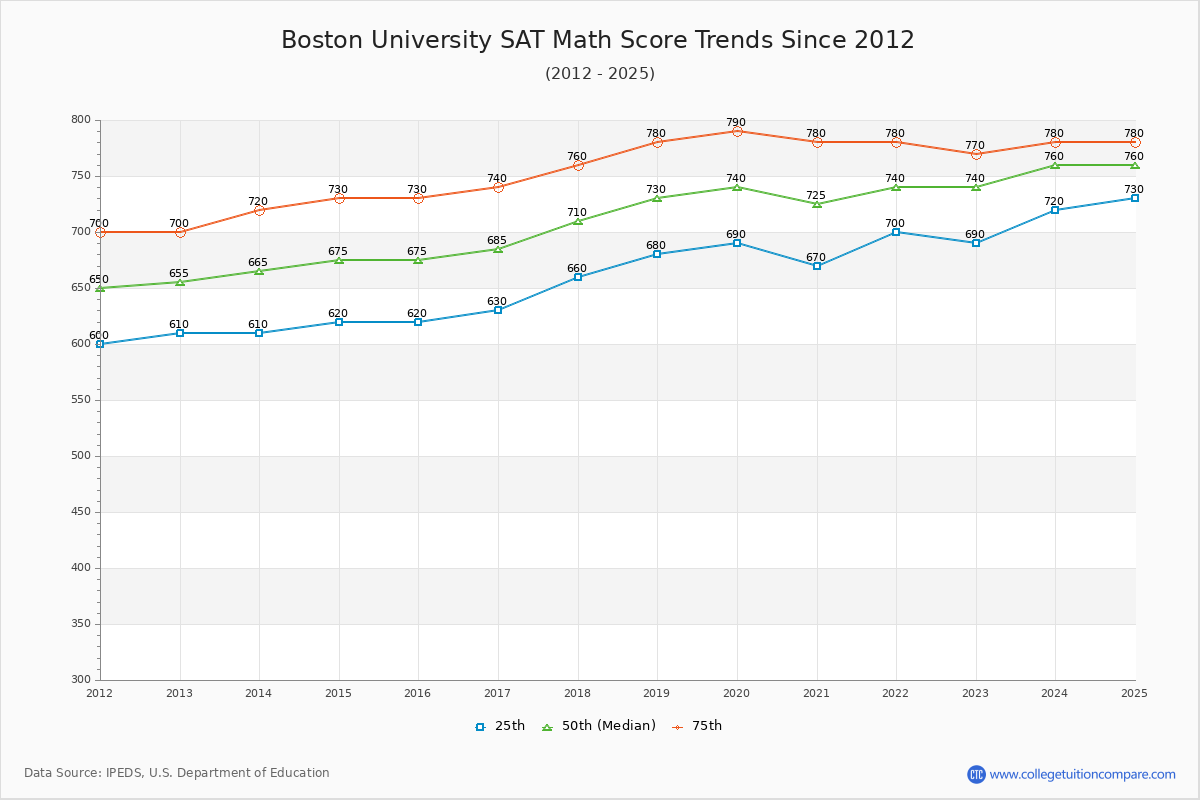
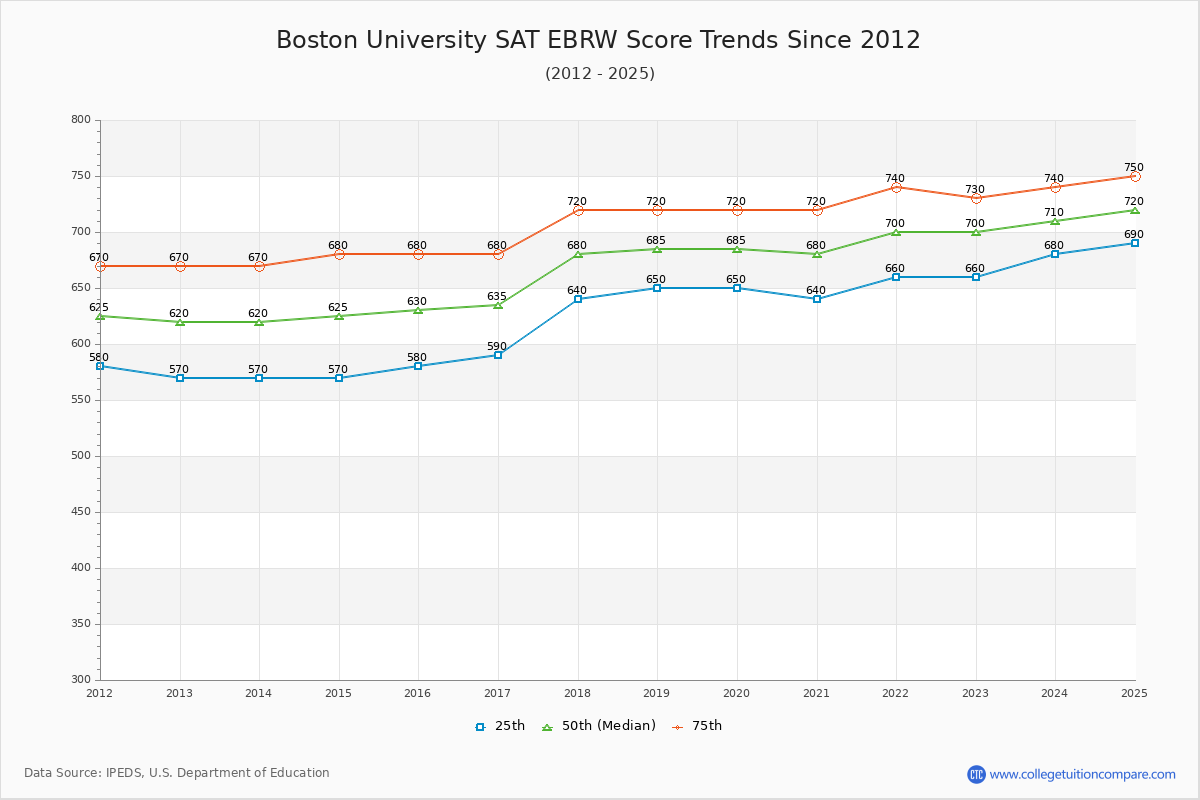
| Year | Total | Math | Evidence-Based Reading and Writing | ||||||
|---|---|---|---|---|---|---|---|---|---|
| 25 th | 50 th | 75 th | 25 th | 50 th | 75 th | 25 th | 50 th | 75 th | |
| 2013-14 | 1,180 | 1,285 | 1,390 | 610 | 665 | 720 | 570 | 620 | 670 |
| 2014-15 | 1,190 | 1,300 | 1,410 | 620 | 675 | 730 | 570 | 625 | 680 |
| 2015-16 | 1,200 | 1,305 | 1,410 | 620 | 675 | 730 | 580 | 630 | 680 |
| 2016-17 | 1,220 | 1,320 | 1,420 | 630 | 685 | 740 | 590 | 635 | 680 |
| 2017-18 | 1,300 | 1,390 | 1,480 | 660 | 710 | 760 | 640 | 680 | 720 |
| 2018-19 | 1,330 | 1,415 | 1,500 | 680 | 730 | 780 | 650 | 685 | 720 |
| 2019-20 | 1,340 | 1,425 | 1,510 | 690 | 740 | 790 | 650 | 685 | 720 |
| 2020-21 | 1,310 | 1,405 | 1,500 | 670 | 725 | 780 | 640 | 680 | 720 |
| 2021-22 | 1,360 | 1,440 | 1,520 | 700 | 740 | 780 | 660 | 700 | 740 |
| 2022-23 | 1,350 | 1,440 | 1,500 | 690 | 740 | 770 | 660 | 700 | 730 |
| 2023-24 | 1,400 | 1,470 | 1,520 | 720 | 760 | 780 | 680 | 710 | 740 |
| Average | 1289 | 1381 | 1469 | 663 | 713 | 760 | 626 | 668 | 709 |
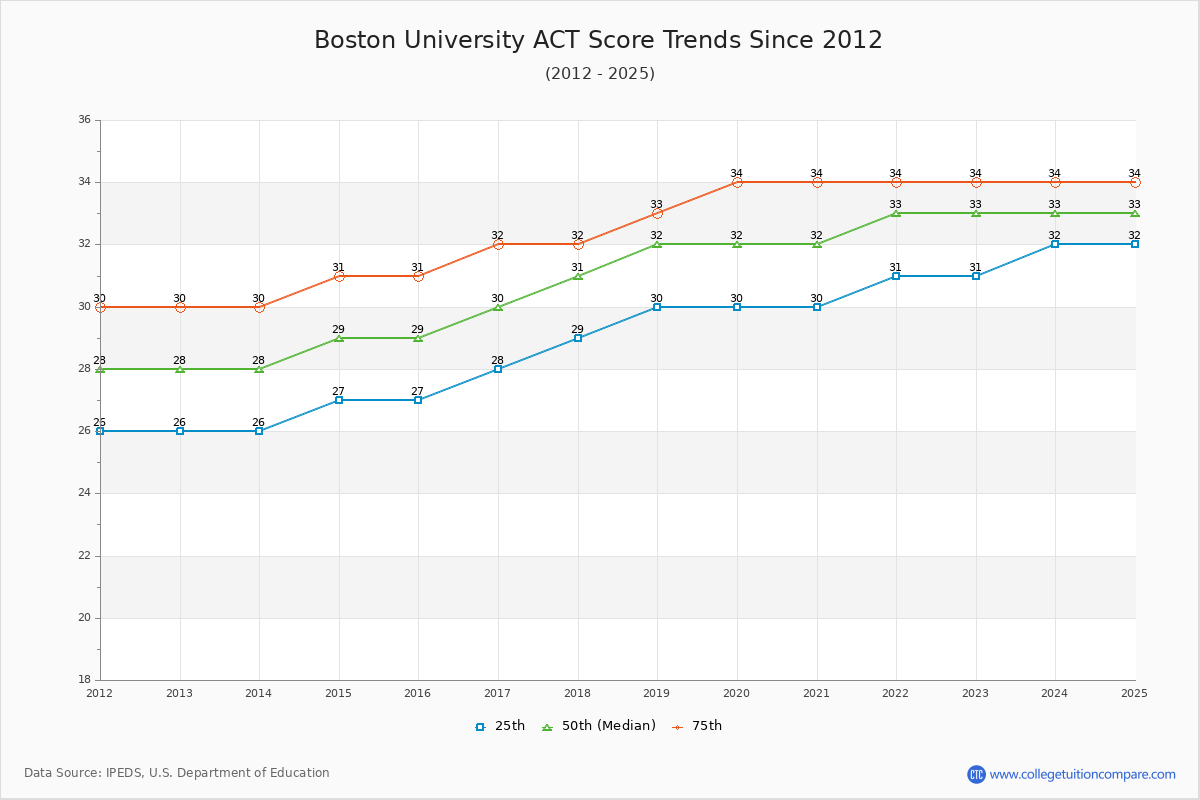
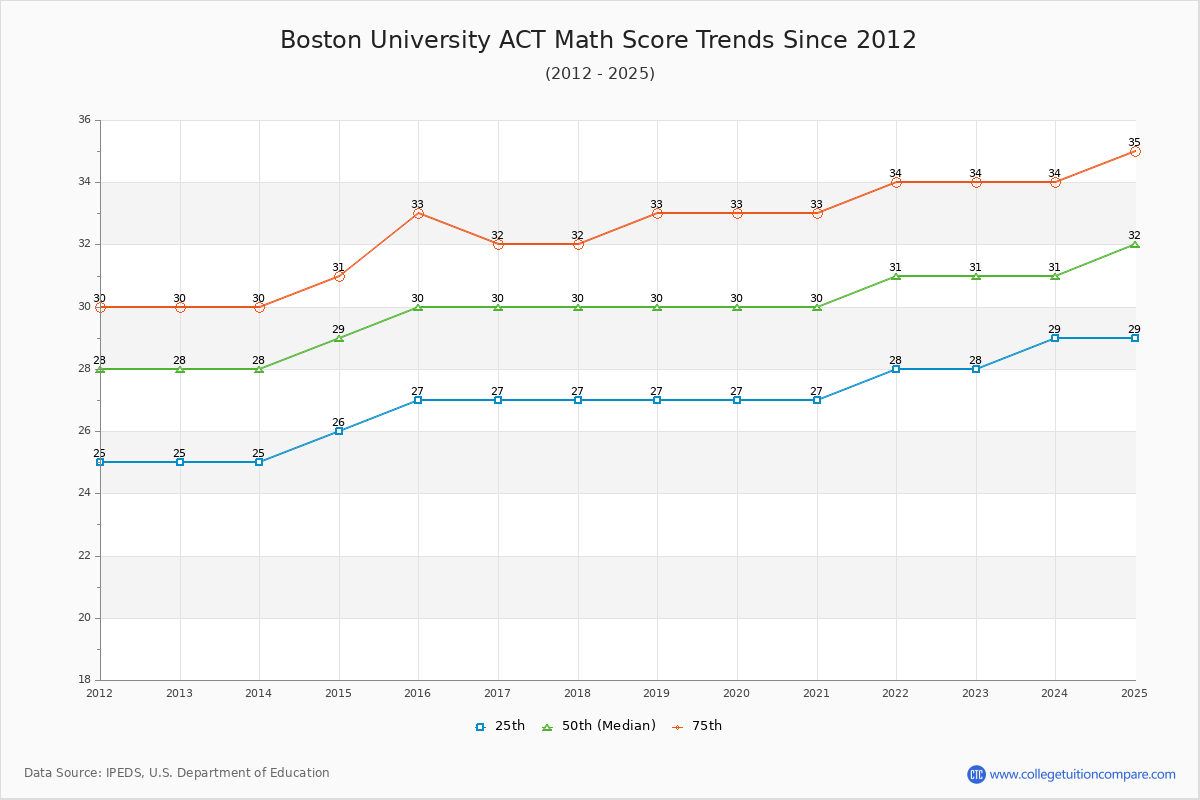
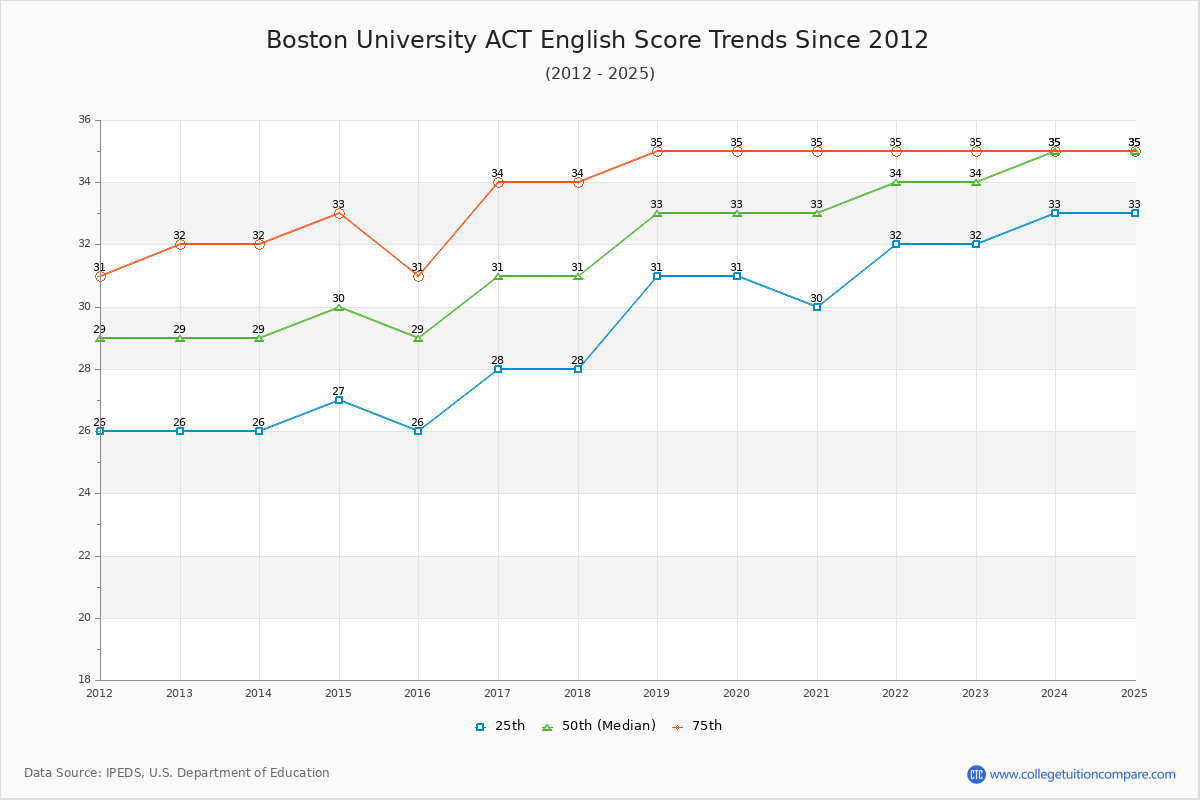
The 2024 ACT score is 33 at BU. Over the past 12 years, the average ACT score of the last 12 years is 29 (25 th percentile) and 33 (75 th percentile). Compared to similar schools, the submitted ACT scores are extremely competitive and high at BU.
The following table and chart show the changes in ACT scores at Boston University since 2013.
| Year | Composite | English | Math | ||||||
|---|---|---|---|---|---|---|---|---|---|
| 25 th | 50 th | 75 th | 25 th | 50 th | 75 th | 25 th | 50 th | 75 th | |
| 2013-14 | 26 | 28 | 30 | 26 | 29 | 32 | 25 | 28 | 30 |
| 2014-15 | 27 | 29 | 31 | 27 | 30 | 33 | 26 | 29 | 31 |
| 2015-16 | 27 | 29 | 31 | 26 | 29 | 31 | 27 | 30 | 33 |
| 2016-17 | 28 | 30 | 32 | 28 | 31 | 34 | 27 | 30 | 32 |
| 2017-18 | 29 | 31 | 32 | 28 | 31 | 34 | 27 | 30 | 32 |
| 2018-19 | 30 | 32 | 33 | 31 | 33 | 35 | 27 | 30 | 33 |
| 2019-20 | 30 | 32 | 34 | 31 | 33 | 35 | 27 | 30 | 33 |
| 2020-21 | 30 | 32 | 34 | 30 | 33 | 35 | 27 | 30 | 33 |
| 2021-22 | 31 | 33 | 34 | 32 | 34 | 35 | 28 | 31 | 34 |
| 2022-23 | 31 | 33 | 34 | 32 | 34 | 35 | 28 | 31 | 34 |
| 2023-24 | 32 | 33 | 34 | 33 | 35 | 35 | 29 | 31 | 34 |
| Average | 29 | 31 | 33 | 29 | 32 | 34 | 27 | 30 | 33 |
The following table compares SAT score changes from last year between Boston University and similar schools.
| 2024 | 2023 | Change % | |
|---|---|---|---|
| Boston University | 1440 | 1440 | - |
| College of the Holy Cross | 1350 | 1330 | 1.50% |
| United States Naval Academy | 1310 | 1310 | - |
| Lehigh University | 1410 | 1408 | 0.14% |
| United States Military Academy | 1340 | 1320 | 1.52% |
| Bucknell University | 1390 | 1373 | 1.24% |
Share your experiences and thoughts about Boston University. It will be a great help to applicants and prospective students!